Estimated Electricity Cost Of Mining Bitcoin
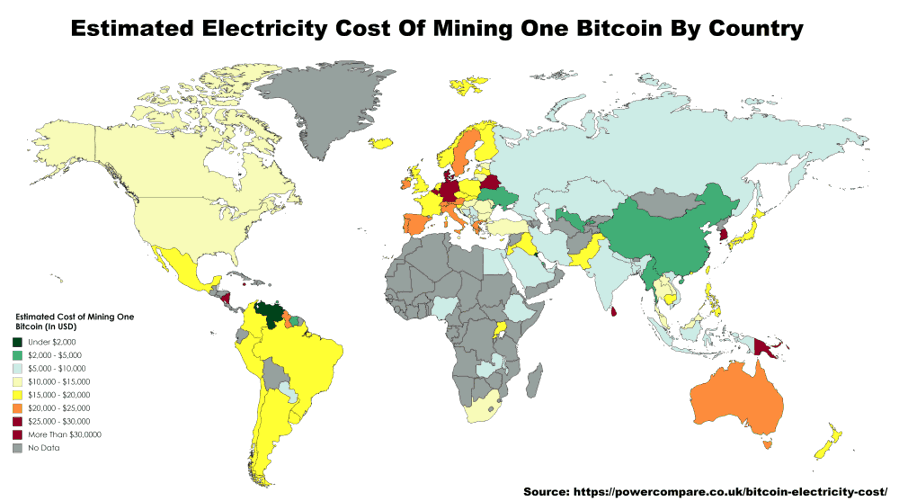
The cost of electricity varies from country to country, and so the cost of doing any work that uses electricity varies around the world. And there are few industries as energy-intensive as cryptocurrency mining - especially Bitcoin. So, we were curious and put together a map to show a very rough estimate of the current electricity costs of mining one Bitcoin in countries around the world, where data is available.
Based on our research, Kuwait is the cheapest country in the world to mine Bitcoins while the Solomon Islands would be the most expensive.
What is apparent is that Bitcoin’s total electricity consumption is huge. It has even been reported that Bitcoin mining is consuming more electricity than 159 countries, including Ireland and most countries in Africa.
As of March 2018, that number has increased to 173, which would mean if Bitcoin mining activity were a country it would be the 47th largest consumer on earth (slightly less than Kuwait but more than Greece).
Overall, the total amount of energy devoted to Bitcoin mining stands at 53.28 TWh according to the Bitcoin Energy Consumption Index, an increase of 83% since November 2017!
Despite the increase in electricity required to mine Bitcoins and the dramatic decline in the price ($11,455 at the time of writing), mining remains hugely profitable in certain countries with cheap electricity.
Some quick facts on the electricity costs of mining Bitcoins:
- The 5 cheapest countries are Kuwait ($1,415), Venezuela ($1,630), Myanmar ($3,087), Bahrain ($3,628) and China ($3,645).
- The 5 most expensive countries/territories are: Solomon Islands ($80,189), Belarus ($71,698), South Korea ($53,173), Vanuatu ($51,458), and the US Virgin Islands ($43,225).
- 39 countries have estimated electricity mining costs below the current price of one Bitcoin ($11,455)
- And 80 countries have estimated electricity mining costs below Bitcoins’s all-time high ($19,498.63)
However, as with many things Bitcoin-related, the numbers above are rough estimates only. Here is how they were arrived at:
Data Sources & Methodology
Here’s how we arrived at our estimates:
For electricity consumption, we used the Bitcoin Energy Consumption Index, which currently estimates that it takes 781 kWh of electricity per Bitcoin transaction. We realise that many people dispute the values of this index, but you can read about the Criticism and Validation of this index here and make up your own mind. Worst case this estimate is too high and the real energy costs are less making mining cheaper.
For the number of Bitcoin transactions per block, we used an average of Blockchain’s data for February 2018. It showed that there were an average of 1,372.65 transactions per block for that month and each block currently represents 12.5 Bitcoins.
For electricity prices per kWh, we used Eurostat data for Europe and Wikipedia‘s estimates for all other countries.
When there was a range we took the midpoint and when there were different prices based on subsidies, we took the price without subsidies. Prices for Europe are inclusive of VAT and all other charges. All prices are based on residential prices rather than commercial or industrial prices (which can often be far cheaper). All prices have been converted to USD based on official exchange rates.
Given how incredibly complex electricity pricing can be, these prices are only estimates but are likely significantly higher than what professional miners actually pay.
To arrive at a pricing estimate by country we did the following:
(Price per kWh * Electricity consumed per transaction * number of transactions per block) / Bitcoins per Block
This gave us a price in cents so we divided by a further 100 to get a price in US dollars.
The map was created using MapChart.net.
List of Electricity Cost Of Mining One Bitcoin By Country
| COUNTRY | PRICE PER KWH (US CENTS) | COST PER BITCOIN (USD) |
|---|---|---|
| Kuwait | 1.7 | $1,415.09 |
| Venezuela | 1.9 | $1,629.50 |
| Myanmar | 3.6 | $3,087.47 |
| Bahrain | 4.2 | $3,627.78 |
| China | 4.3 | $3,644.93 |
| Surinam | 4.4 | $3,747.85 |
| Ukraine | 4.8 | $4,145.71 |
| Uzbekistan | 5.0 | $4,245.28 |
| Trinidad and Tobago | 5.0 | $4,288.16 |
| Bangladesh | 6.1 | $5,227.27 |
| Kazakhstan | 6.5 | $5,574.61 |
| India | 7.0 | $6,003.42 |
| Ethiopia | 7.2 | $6,174.95 |
| Paraguay | 7.9 | $6,792.44 |
| Georgia | 8.0 | $6,861.05 |
| Saudi Arabia | 8.0 | $6,861.05 |
| Vietnam | 8.1 | $6,951.11 |
| Kosovo | 8.1 | $6,983.35 |
| Serbia | 8.2 | $7,004.45 |
| Russia | 8.2 | $7,032.58 |
| United Arab Emirates | 8.3 | $7,122.63 |
| Brunei | 8.6 | $7,409.94 |
| Zambia | 9.0 | $7,718.69 |
| Nepal | 9.2 | $7,890.21 |
| Nigeria | 9.6 | $8,203.25 |
| Egypt | 9.6 | $8,250.42 |
| Macedonia | 10.1 | $8,650.07 |
| Indonesia | 10.3 | $8,807.88 |
| Albania | 10.4 | $8,903.25 |
| Iran | 10.5 | $9,005.13 |
| Bosnia and Herzegovina | 10.6 | $9,061.48 |
| Bulgaria | 11.7 | $10,074.17 |
| Laos | 12.0 | $10,248.70 |
| Montenegro | 12.0 | $10,253.50 |
| Moldova | 12.0 | $10,306.25 |
| United States | 12.5 | $10,720.40 |
| Turkey | 12.9 | $11,055.22 |
| Malaysia | 13.0 | $11,132.06 |
| Fiji | 13.1 | $11,234.98 |
| Thailand | 13.4 | $11,492.27 |
| Lithuania | 13.7 | $11,772.54 |
| Hungary | 13.8 | $11,867.48 |
| Gibraltar | 14.4 | $12,349.90 |
| Canada, Ontario | 14.6 | $12,521.42 |
| Croatia | 14.7 | $12,616.45 |
| Romania | 14.7 | $12,637.55 |
| Estonia | 14.8 | $12,732.49 |
| Singapore | 15.0 | $12,838.75 |
| South Africa | 15.0 | $12,864.48 |
| Israel | 15.4 | $13,164.65 |
| Malta | 15.7 | $13,481.46 |
| Slovakia | 17.7 | $15,137.63 |
| Czech Republic | 17.7 | $15,169.28 |
| Peru | 17.7 | $15,180.08 |
| Poland | 17.9 | $15,369.70 |
| Pakistan | 18.0 | $15,437.37 |
| Hong Kong | 18.0 | $15,475.96 |
| Colombia (Bogotá) | 18.1 | $15,480.25 |
| Philippines | 18.2 | $15,626.05 |
| Cambodia | 18.3 | $15,707.52 |
| Brazil | 18.5 | $15,866.19 |
| Iraq | 18.8 | $16,080.59 |
| Jordan | 19.0 | $16,295.00 |
| Argentina (Concordia) | 19.1 | $16,406.49 |
| New Zealand | 19.2 | $16,423.65 |
| Netherlands | 19.2 | $16,477.34 |
| Uganda | 19.3 | $16,517.99 |
| Mexico | 19.3 | $16,535.14 |
| Finland | 19.4 | $16,677.76 |
| Latvia | 19.5 | $16,730.51 |
| Iceland | 19.7 | $16,857.09 |
| Slovenia | 19.8 | $16,973.13 |
| Luxembourg | 19.9 | $17,036.43 |
| Norway | 20.2 | $17,321.24 |
| Taiwan | 20.4 | $17,495.69 |
| France | 20.8 | $17,827.59 |
| Liechtenstein | 21.2 | $18,186.25 |
| United Kingdom | 21.7 | $18,629.30 |
| Uruguay | 21.8 | $18,674.93 |
| Japan | 22.0 | $18,867.90 |
| Rwanda | 22.8 | $19,554.00 |
| Palau | 22.8 | $19,579.73 |
| Cyprus | 22.9 | $19,652.55 |
| Chile | 23.1 | $19,819.87 |
| Greece | 23.8 | $20,422.61 |
| Sweden | 23.8 | $20,422.61 |
| Austria | 24.0 | $20,570.30 |
| Switzerland | 25.0 | $21,440.79 |
| Italy | 26.3 | $22,595.68 |
| Australia | 26.7 | $22,898.77 |
| Guyana | 26.8 | $22,984.53 |
| American Samoa | 27.7 | $23,756.40 |
| Portugal | 28.1 | $24,093.62 |
| Spain | 28.2 | $24,220.21 |
| Ireland | 28.4 | $24,315.15 |
| Tahiti | 29.1 | $24,914.20 |
| Papua New Guinea | 29.2 | $25,042.85 |
| Sri Lanka | 29.3 | $25,154.34 |
| Curaçao | 30.8 | $26,440.79 |
| Western Samoa | 32.6 | $27,958.79 |
| Kiribati | 32.7 | $28,044.56 |
| Belgium | 34.4 | $29,526.29 |
| Turks and Caicos Islands | 35.4 | $30,351.59 |
| Tuvalu | 36.6 | $31,346.44 |
| Marshall Islands | 37.1 | $31,818.14 |
| Germany | 37.5 | $32,152.96 |
| Denmark | 37.5 | $32,163.51 |
| Cook Islands | 42.4 | $36,363.58 |
| Niue | 44.3 | $37,993.09 |
| New Caledonia | 44.5 | $38,121.73 |
| Jamaica | 44.7 | $38,336.14 |
| Tonga | 47 | $40,308.69 |
| Nicaragua | 48 | $41,166.32 |
| United States Virgin Islands | 50.4 | $43,224.64 |
| Vanuatu | 60 | $51,457.90 |
| South Korea | 62 | $53,173.17 |
| Belarus | 83.6 | $71,698.01 |
| Solomon Islands | 93.5 | $80,188.57 |
Also see: